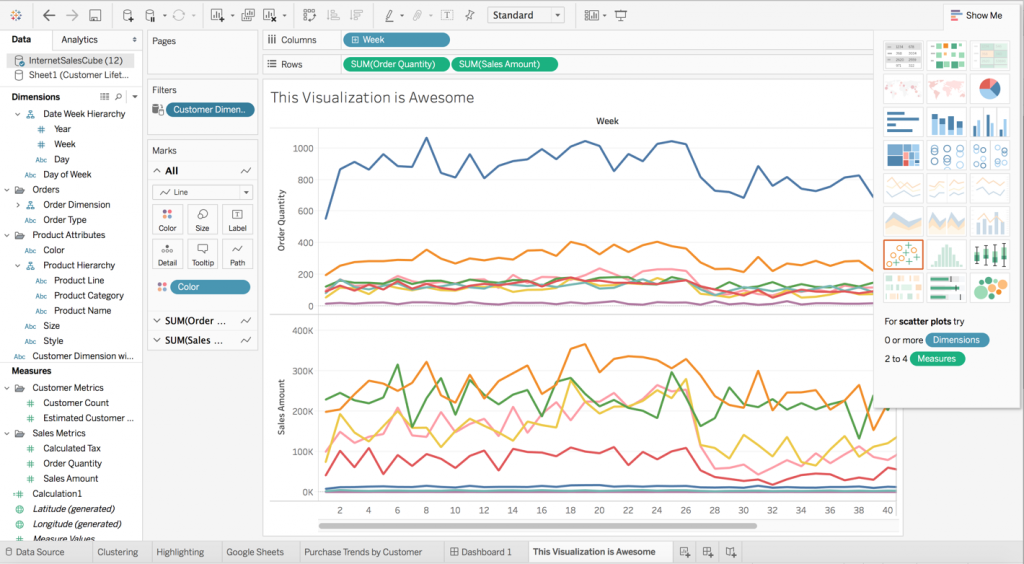
Your data just got better, say thanks to Tableau 10. The big data geeks have worked on both the beauty and brains of Tableau, to make the analyses easier, faster and exceptionally delightful. Tableau 10 features an exciting new look and feel, loaded with cute fonts and beautiful colours to make your viz sparkle.
We are thrilled. We have been waiting for days to gauge how some of the Tableau 10 new features will synchronise with our conventional business interface for Hadoop. We have culled out some of the best features of Tableau 10, which had made us zealous and left us buzzing. And here they are ..
An extremely visually appealing new interface
Connect the little dots to get a bigger picture. The new interface pays enough attention to minute details making the entire visualization environment pleasant and engaging.
For example: When you name a worksheet tab, the same name pops up as an inline title, blending seamlessly with the viz – now isn’t that great!
Ten on ten to Tableau’s clustering feature
Owing to Tableau’s outstanding analytics capabilities, Tableau 10’s clustering feature is the next best thing. The feature focuses on the elements of a pool of data values and visually highlights an inconspicuous number of clusters, which is found in the data. This makes it easier for an analyst to run his eyes through the data sets they need to investigate.
Spotting the zip codes was never so easy before, come and take a look at the following video.
Tableau 10’s highlighting feature helps in finding a needle from the big data haystack
While developing interesting data visualizations, we often need to present the most comprehensive view of the data, so that the consumers get the right information they are looking for, without foraging here and there. With Tableau 10’s highlighting feature, this goal is easily achieved.
In the video shared below, we can see the weekly trend of sales and numbers of customer across the states included in the sales transaction data.
Multisource data integration and blending
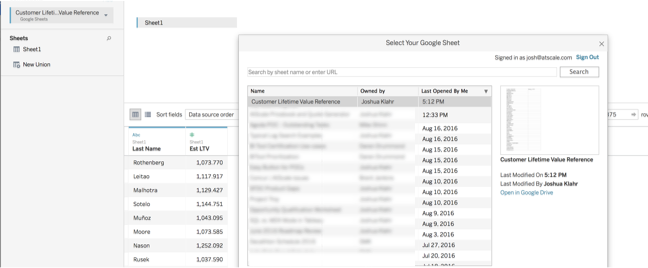
By using Tableau 10, the users will be able to directly connect to data stored in Google Sheets.
Scroll down:
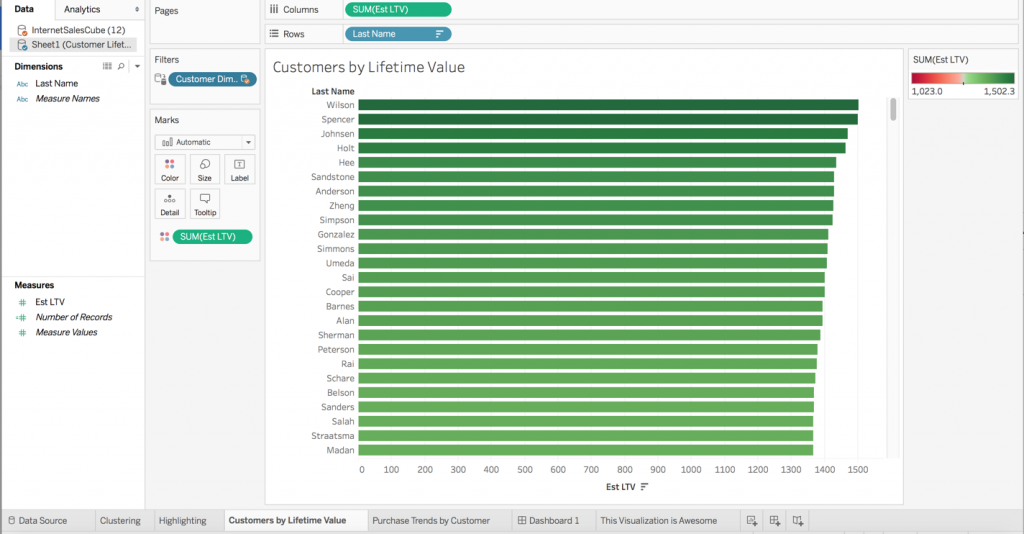
Develop visual representation of the most-favoured customers, based on estimated lifetime value.
Once the new data source is created, you can now use the data-relationships feature to let Tableau know that the Last Name column from the Google Sheets data set is mapped to the Customer Dimension column from my AtScale big data virtual cube.
Soon after the above relation has been accomplished, a filter is initiated on my Purchase Trends by Ranked Customers dashboard. Watch the video, to get a clearer picture.
These are some of the slivers of what’s new in Tableau 10. Want even more? Join DexLab Analytics for intensive Tableau Certification Training. This premier data science training institute excels in data analytics certification courses. Get interesting data knowledge and Tableau insights from the veterans!
Sources: tableau.com
Interested in a career in Data Analyst?
To learn more about Data Analyst with Advanced excel course – Enrol Now.
To learn more about Data Analyst with R Course – Enrol Now.
To learn more about Big Data Course – Enrol Now.To learn more about Machine Learning Using Python and Spark – Enrol Now.
To learn more about Data Analyst with SAS Course – Enrol Now.
To learn more about Data Analyst with Apache Spark Course – Enrol Now.
To learn more about Data Analyst with Market Risk Analytics and Modelling Course – Enrol Now.


Comments are closed here.