R functions are used to produce chart templates to keep the look and feel of the reports intact.
In this post you will come across how to create chart templates with R functions – all the R users should be accustomed to the calling functions so as to perform calculations and outline plots accurately. Remember what colors and fonts to use each time: R functions are used as a short-cut for producing customary-looking charts.
How to frame chart templates with R functions
We have created this using Displayr/flipStandardCharts package on GitHub, but this technique can be more or less applied on almost all charting package in R.
The code used to install the package is:
library(devtools)
install_github("Displayr/flipStandardCharts")
The data is:
gdp = c(156080,	89633,	8583,	15275,	12115,	3007,	24204,	1617,	1756,	9601,	617,	7834,	34999,	1727,	336297,	10179,	72374,	14214,	965,	42690,	6299,	1126,	36165,	70529,	2200,	2101,	9991,	5442,	14045,	4635,	12164,	101445,	11015,	10267,	7509,	405083,	8376,	351,	14765,	1427,	3669,	6217,	294841,	9015,	95584,	3727,	47431,	4400,	42063,	25528,	19551,	16289,	19469,	31859,	221415,	2237,	11400,	67430,	20017,	11199145,	1442,	2263523,	932259,	393436,	171489,	318744,	4939384,	38655,	133657,	1411246,	114041,	6551,	15903,	47537,	296359,	3591,	11160,	21144,	66293,	283660,	304905,	152469,	1283162,	646438,	296966,	81322,	6952,	406840,	857749,	36180,	348743,	67220,	202616,	27318,	11927,	10547,	386428,	37848,	47433,	466366,	16560,	52395,	50425,	19802,	192925,	306143,	23137,	236785,	2465454,	14333,	3466757,	194559,	124343,	20047,	294054,	1849970,	27677,	6664,	42739,	59948,	10900,	10949,	6750,	4173,	770845,	370557,	469509,	204565,	186691,	37745,	89552,	43991,	1232088,	511000,	659827,	93270,	2618886,	1449,	9047,	4588,	1765,	1529760,	57436,	87133,	525,	71584,	26797,	1016,	68763,	8023,	21517,	14027,	1045998,	13231,	55188,	917,	1379,	771,	20989,	18569100,	1204616,	4632,	166,	183,	322,	102,	185017,	293,	16929,	786,	1202,	395,	34,	774,	545866,	33806,	1796187,	247028,	282463,	97802,	3446,	27441,	192094,	3621,	52420)
names(gdp) = c('Algeria',	'Angola',	'Benin',	'Botswana',	'Burkina Faso',	'Burundi',	'Cameroon',	'Cape Verde',	'Central African Republic',	'Chad',	'Comoros',	'Congo',	'Democratic Republic of the Congo',	'Djibouti',	'Egypt',	'Equatorial Guinea',	'Ethiopia',	'Gabon',	'Gambia',	'Ghana',	'Guinea',	'Guinea-Bissau',	"Cote d'Ivoire",	'Kenya',	'Lesotho',	'Liberia',	'Madagascar',	'Malawi',	'Mali',	'Mauritania',	'Mauritius',	'Morocco',	'Mozambique',	'Namibia',	'Niger',	'Nigeria',	'Rwanda',	'Sao Tome and Principe',	'Senegal',	'Seychelles',	'Sierra Leone',	'Somalia',	'South Africa',	'South Sudan',	'Sudan',	'Swaziland',	'Tanzania',	'Togo',	'Tunisia',	'Uganda',	'Zambia',	'Zimbabwe',	'Afghanistan',	'Bahrain',	'Bangladesh',	'Bhutan',	'Brunei Darussalam',	'Myanmar',	'Cambodia',	'China',	'Timor-Leste',	'India',	'Indonesia',	'Iran',	'Iraq',	'Israel',	'Japan',	'Jordan',	'Kazakhstan',	'South Korea',	'Kuwait',	'Kyrgyzstan',	'Lao',	'Lebanon',	'Malaysia',	'Maldives',	'Mongolia',	'Nepal',	'Oman',	'Pakistan',	'Philippines',	'Qatar',	'Russian Federation',	'Saudi Arabia',	'Singapore',	'Sri Lanka',	'Tajikistan',	'Thailand',	'Turkey',	'Turkmenistan',	'United Arab Emirates',	'Uzbekistan',	'Vietnam',	'Yemen',	'Albania',	'Armenia',	'Austria',	'Azerbaijan',	'Belarus',	'Belgium',	'Bosnia and Herzegovina',	'Bulgaria',	'Croatia',	'Cyprus',	'Czech Republic',	'Denmark',	'Estonia',	'Finland',	'France',	'Georgia',	'Germany',	'Greece',	'Hungary',	'Iceland',	'Ireland',	'Italy',	'Latvia',	'Liechtenstein',	'Lithuania',	'Luxembourg',	'Macedonia',	'Malta',	'Moldova',	'Montenegro',	'Netherlands',	'Norway',	'Poland',	'Portugal',	'Romania',	'Serbia',	'Slovakia',	'Slovenia',	'Spain',	'Sweden',	'Switzerland',	'Ukraine',	'United Kingdom',	'Antigua and Barbuda',	'Bahamas',	'Barbados',	'Belize',	'Canada',	'Costa Rica',	'Cuba',	'Dominica',	'Dominican Republic',	'El Salvador',	'Grenada',	'Guatemala',	'Haiti',	'Honduras',	'Jamaica',	'Mexico',	'Nicaragua',	'Panama',	'St. Kitts and Nevis',	'St. Lucia',	'St. Vincent and the Grenadines',	'Trinidad and Tobago',	'United States',	'Australia',	'Fiji',	'Kiribati',	'Marshall Islands',	'Micronesia',	'Nauru',	'New Zealand',	'Palau',	'Papua New Guinea',	'Samoa',	'Solomon Islands',	'Tonga',	'Tuvalu',	'Vanuatu',	'Argentina',	'Bolivia',	'Brazil',	'Chile',	'Colombia',	'Ecuador',	'Guyana',	'Paraguay',	'Peru',	'Suriname',	'Uruguay')
gdp = sort(gdp, decreasing = TRUE) / 1000
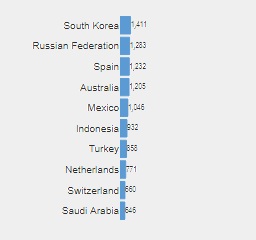
The chart above was created using:
library(flipStandardCharts)
Chart(gdp[1:10],
    type = "Bar",
    data.label.show = TRUE,
    data.label.font.size = 8,
    data.label.font.family = "Arial Narrow",
    data.label.prefix = "$",
    data.label.decimals = 0,
    y.grid.width = 0,
    x.tick.show = FALSE,
    x.grid.width = 0,
    x.bounds.minimum = 0,
    x.bounds.maximum = 20000)
Step 1: Generate a Simple Function
Check out the code below to create something similar to the chart above.. The key points are here:
- The first function calls for creating a function named MyBarChartTemplate.
- The xon the first line tells us that when we use this function, whatever data we use will be used in place of x when the code below is run. In this case, it means that the data will be plotted using the Chart function from flipStandardCharts.
- Require (flipStandardCharts)means that we will load the flipStandardCharts package whenever we run the function (if it is not already loaded).
- The very last line says to use the function to create a chart of the first 10 numbers in gdp.
- Everything else is identical to the example above.
MyBarChartTemplate = function(x)
{
    require(flipStandardCharts)
    Chart(x,
        data.label.show = TRUE,
        data.label.font.size = 8,
        data.label.font.family = "Arial Narrow",
        data.label.decimals = 0,
        type = "Bar",
        y.grid.width = 0,
        x.tick.show = FALSE,
        x.grid.width = 0,
        x.bounds.minimum = 0,
        x.bounds.maximum = 20000)
}
MyBarChartTemplate(gdp[1:10])
Step 2: Use the function on different data
It’s time to reuse the function. The chart here is formed with a single line of code, coupled with similar formatting..
MyBarChartTemplate(gdp[11:20])
Step 3: Adding more parameters to the function
The functions that have been developed just now include a single input, x. It is more productive to develop functions that consist of multiple inputs. Parameter is the formal name of an input in a function.
In the following example, we have added a parameter known as decimals and infused a default value of 0. See, how we have both added decimals = 0 on the first line. We have also altered line 9, the value of decimals is passed to data.label.decimals.
This is the following implication:
- If you type MyBarChartTemplate2(gdp[11:20]), you will reach the same chart as when using MyBarChartTemplate(gdp[11:20]).
- Instead, If we type MyBarChartTemplate2(gdp[11:20], decimals = 2), we will get a chart with two decimal points in each of the value labels.
MyBarChartTemplate2 = function(x, decimals = 0)
{
    require(flipStandardCharts)
    Chart(x,
        data.label.show = TRUE,
        data.label.font.size = 8,
        data.label.font.family = "Arial Narrow",
        data.label.prefix = "$",
        data.label.decimals = decimals,
        type = "Bar",
        y.grid.width = 0,
        x.tick.show = FALSE,
        x.grid.width = 0,
        x.bounds.minimum = 0,
        x.bounds.maximum = 20000)
}
Step 4: Storage and automation is important
If you find any function important and useful in future, you must create a file or some files in which you can store all of them and finally paste them in R sessions the moment you start working on something.
Followed by this, create your own package to automate the entire process.
For example, flipstandardcharts is itself the chart that we have created in this post to quickly draw charts with plotly.
Hope this blogpost on R functions was helpful!
For more such interesting technical blogs and interesting updates, fix your eyes on DexLab Analytics. R programming certification in Pune is extremely helpful for all the aspiring data-friendly candidates. Boost your profile with R language training in Pune today!!
This post originally appeared on – www.r-bloggers.com/create-chart-templates-using-r-functions
Interested in a career in Data Analyst?
To learn more about Machine Learning Using Python and Spark – click here.
To learn more about Data Analyst with Advanced excel course – click here.
To learn more about Data Analyst with SAS Course – click here.
To learn more about Data Analyst with R Course – click here.
To learn more about Big Data Course – click here.
online certification, online courses, R Analytics Certification, R language training, R predictive modelling, R programming certification, R Programming Training, Uncategorized


Comments are closed here.