(This is in continuation of the previous blog, which was published on 22nd April, 2019 – www.dexlabanalytics.com/blog/a-beginners-guide-to-learning-data-science-fundamentals )
In this blog, we’ll try to get a hands-on understanding of the Bayes’ Theorem. While doing so, hopefully we’ll be able to grasp a basic understanding of concepts such as Prior odds ratio, Likelihood ratio and Posterior odds ratio.
Arguably, a lot of classification problems have their root in Bayes’ Theorem. Reverend T. Bayes came up with this superior logical function, which mathematically deducts the probability of an event occurring from a larger set by “flipping” the conditional probabilities.
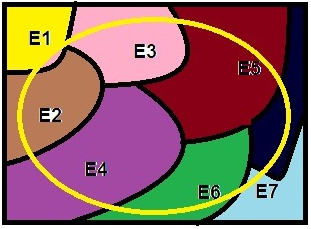
Consider, E1, E2, E3,……..En to be a partition a larger set “S” and now define an Event – A, such that A is a subset of S.

Let the square be the larger set “S” containing mutually exclusive events Ei’s. Now, let the yellow ring passing through all Ei’s be an event – A.
Using conditional probabilities, we know,

Also, the relationship:
Law of total probability states:
Rearranging the values of & gives us the Bayes Theorem:
The values of are also known as prior probabilities, the event A is some event, which is known to have occurred and the conditional probability is known as the posterior probability.
Now that, you’ve got the maths behind it, it’s time to visualise its practical application. Bayesian thinking is a method of applying Bayes’ Theorem into a practical scenario to make sound judgements.
The next blog will be dedicated to Bayesian Thinking and its principles.
For now, imagine, there have been news headlines about builders snooping around houses they work in. You’ve got a builder in to work on something in your house. There is room for all sorts of bias to influence you into believing that the builder in your house is also an opportunistic thief.
However, if you were to apply Bayesian thinking, you can deduce that only a small fraction of the population are builders and of that population, a very tiny proportion is opportunistic thieves. Therefore, the probability of the builder in your house being an opportunistic thief is actually a product of the two proportions, which is indeed very-very small.
Technically speaking, we call the resulting posterior odds ratio as a product of prior odds ratio and likelihood ratio. More on applying Bayesian Thinking coming up in the next blog.
In the meantime try this exercise and leave your comments below in the comments section.
In the above example on “snooping builders”, what are your:
- Ei’s
- Event – A
- “S”
About the Author: Nish Lau Bakshi is a professional data scientist with an actuarial background and a passion to use the power of statistics to tackle various pressing, daily life problems.
About the Institute: DexLab Analytics is a premier data analyst training institute in Gurgaon specializing in an enriching array of in-demand skill training courses for interested candidates. Skilled industry consultants craft state-of-the-art big data courses and excellent placement assistance ensures job guarantee.
For more from the tech series, stay tuned!
Interested in a career in Data Analyst?
To learn more about Data Analyst with Advanced excel course – Enrol Now.
To learn more about Data Analyst with R Course – Enrol Now.
To learn more about Big Data Course – Enrol Now.To learn more about Machine Learning Using Python and Spark – Enrol Now.
To learn more about Data Analyst with SAS Course – Enrol Now.
To learn more about Data Analyst with Apache Spark Course – Enrol Now.
To learn more about Data Analyst with Market Risk Analytics and Modelling Course – Enrol Now.
analytics course in delhi, analytics courses, analytics courses in delhi ncr, analytics training institute, Big Data, Big Data Analytics, Big data certification, Data analyst certification, Data analyst course, data analyst course in delhi, data analyst institute, Data analyst training institute, data analytics, data analytics certification courses

Comments are closed here.